Install ParaView for visualization
The standard output file of FERRET is Exodus, a file format developed by the Sandia National Laboratory.
ParaView is a powerful open-source visualization toolkit and complies with the Exodus file format (among many others). Suppose there is an output file called out_PTOfilm_T298K_uncoupled.e in the current directory, you can visualize it using Paraview using the following command:
paraview out_PTOfilm_T298K_uncoupled.e
Below is a screenshot of what it looks like:
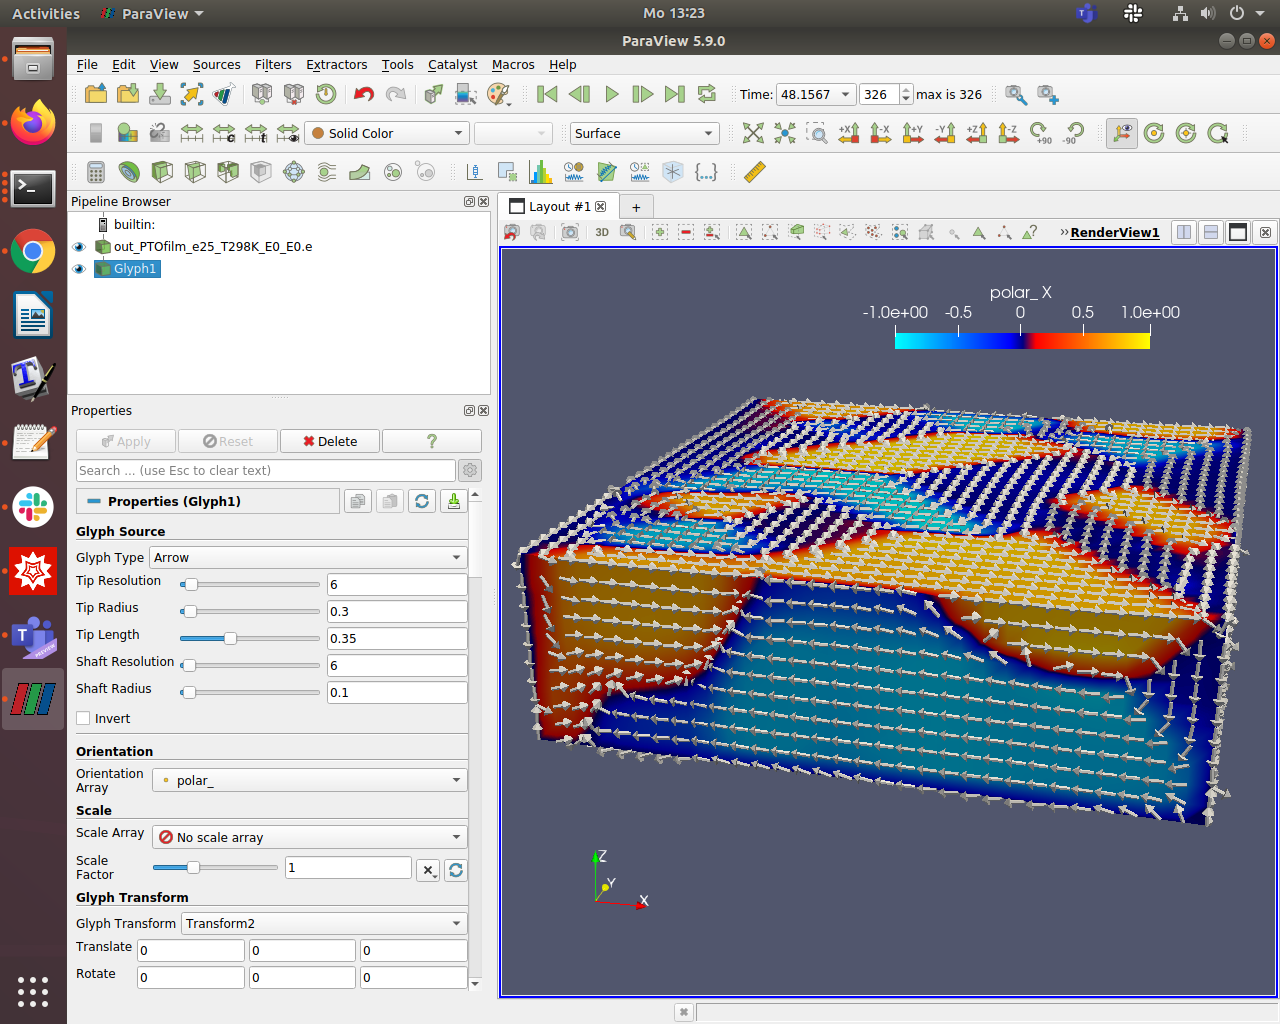
Note that ParaView has many filters for visualization. These "act" on the original Exodus file and can be combined/modified in a multitude of ways. Color-maps, histograms, plots along lines, clips, spatial derivatives of variables, time evolution of spatially averaged quantities, along with many other options are available. As an example, within FERRET, a common variable to solve for is the polarization or magnetization vectors. Shown in the above image is a combination of the monocolor Glyph Filter along with a ColorMap which allows for easy visualization of these vector valued quantities (for example magnitude and direction).
MOOSE also provides options to print postprocessed quantities into the common .csv file format. These also can be opened in ParaView which provides excellent and quick plotting tools to visualize the stored .csv variables in time or space. Below is an example of what can be achieved with the plotting tools assuming we have an output .csv cleverly named out_BFO_P1b1b1bA1b1b1b-001d1m2NmGS_QrdSPTsp_swOoQ.csv.
